


Commentary for Friday, April 24, 2015 ( www.golddealer.com) – Gold closed down $19.20 on the Comex today at $1175.20. The market got weaker overnight in London and Hong Kong and the downward move accelerated in the domestic market.
I don’t know what to makes of this latest weakness – it looks like just more technical selling into the weekend. In a downdraft – if sell stops are hit the market develops a momentum of it’s own. We don’t see any large gold transaction selling across the counter and there was the usual bargain hunting with cash visitors to the store.
The dollar was choppy so not much of a price influence on gold today. The Dollar Index traded between 96.76 and 97.56 – and now stands at 96.94. The euro was stronger today – perhaps the new quantitative easing program is producing benefits.
Today’s price action in gold is a good example of my “don’t jump out the window – just yet” thinking. You already know that gold has been on the longer term a technical underdog. And since the beginning of April when we were nicely over $1200.00 an ounce and the world was worried about Europe – since then news has been neutral to negative. And I have said over the past few weeks that traders are waiting for the other shoe to drop.
It’s clear that the paper trading dogs have been testing the bullish resolve with bear market raids looking for that much talked about breakdown in the price of gold. ETF holdings have generally been trending lower although there have been some up weeks when the international situation is stressed or talk of Greek default comes back into view and outflows reverse.
So today did gold fall off the price cliff? Like I said it is still too soon to tell because if you push aside all the negative press and look at the 30 day price chart you will see gold has traded pretty much between $1185.00 and $1210.00. With all the “on-again” “off-again” gold news of late that only presents a $25.00 range – so professionals would claim “a range bound market”.
The better long term picture is presented in the 6 month chart. During the last six months gold has traded between $1140.00 and $1300.00. We obviously are at the lower end of that rather wide range but today’s closing price ($1175.20) indicates that while the short paper is still testing – gold has solid support at $1140.00 going back to November of last year.
So am I happy? Of course not – gold is not holding a strong hand – the stock markets of the world are roaring – the Fed looks like it will raise interest rates – the housing market has a new swagger – and spec “hot” money is looking elsewhere.
On the other hand – ask yourself why the central banks of the world continue to add to their holdings or why China and India are on a mission when it comes to physical gold ownership. Even the most pessimistic gold observer would admit that the price of gold is looking for a bottom. I like the gold market – up or down but believe we are now approaching that bottom.
It might even take a year or two for the inflation numbers or some other blow-up financial event to once again turn a spotlight on gold bullion. In the meantime buy the dips and take advantage of cheaper prices. In the end you can’t beat the hedge value in a fiat world.
Silver closed down $0.19 at $15.63. A pop in the physical action across the counter in silver bullion today but nothing to write home about – considering the discount to old highs. The high o silver this year (2015) was $18.34 in January – a return to that number would mean a 17% gain from current numbers so I can’t figure out why investors are not lining up.
Platinum closed down $16.00 at $1120.00 and palladium closed up $1.00 at $770.00. Platinum’s discount to gold is now $55.00 and we are seeing some trading of gold bullion for platinum bullion but not what I would have expected given the big discount.
Our Patented Employee Survey – Gold’s Direction Next Week?
Of course it’s not really patented but we do have some fun along the way. This is what the GoldDealer.com employees think – 7 believe gold will be higher next week – 4 think gold will be lower and 2 believe it will be unchanged.
Our Patented Customer Survey – Gold’s Direction Next Week?
Like the employees our customers were given three choices – up – down – unchanged. We limited the survey to a random sampling of 100 transactions – unscientific but worth considering because these people took action: 34 people thought the price of gold would increase next week – 45 believe the price of gold will decrease next week and 21 think prices will remain the same.
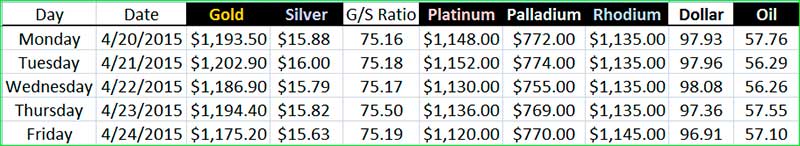
Precious Metal Closes & Dollar Strength – April 20 – April 24
This from James Hyerczyk ( FX Empire) – Crude Oil Slides as Inventories Hit 80-Year High “Crude Oil futures weakened on the news that Saudi Arabia would curtail its military activity in Yemen and following the release of a greater-than-expected weekly supply number.
According to the U.S. Energy Information Administration, commercial inventories rose by 5.3 million barrels from the previous period. Traders were looking for an increase of 3.2 million barrels. The increase in weekly supply brought total inventory to 489 million barrels. This is an 80 year high for this time of the year.”
Oil metrics always lag – so it takes a while to affect price change but the past 30 days crude has moved from around $40.00 to around $58.00. Still the chart looks like a mountain so the technical picture may have a great deal of air in the price. Steady to lower oil prices translates into more consumer money and continued improvement in the economy. All of this of course depends on whether you spend your money – lately consumers have been cautious. Still lower oil portends continued low inflation which does not help the price of gold but makes you feel better at the pump.
This from Bloomberg Business – Swiss Gold Exports Show Asia Buying More as Investors Sell Bars – China and India helped buy up investors’ biggest gold sales in more than a year.
Gold exports to China from the refining hub of Switzerland almost doubled to 46.4 metric tons in March, the most among monthly data starting in January 2014, according to the Swiss Federal Customs Administration. Shipments to India more than doubled to 72.5 tons as imports from the U.K. climbed six fold.
That’s an indication that gold bars are leaving U.K. vaults for Switzerland, where they’re refined and sent to Asia. India and China, the biggest buyers, boosted purchases in 2013 when investors dumped the metal amid the biggest price rout in three decades. Global sales from gold-backed funds totaled 55.7 tons in March, the most since 2013, data compiled by Bloomberg show.
“The big investor outflows from the U.K. via Switzerland to China and India is a continuation of the flow of metal from West to East,” Matthew Turner, an analyst at Macquarie Group Ltd., said by phone from London. “Short-term, it is a sign of weakness, not of strength in the market.”
Investors returned to selling the metal in March after adding to holdings in January and February. Prices declined 2.4 percent in London last month and reached the lowest since December on March 17. Bullion is little changed this year on speculation the first U.S. interest rate increases since 2006 will be gradual. Higher borrowing costs curb gold’s appeal because the metal generally only offers returns through price gains.
Swiss Exports – Swiss gold exports to China climbed from 23.6 tons in February, while those to India, last year’s largest buyer, rose to a four-month high from 27.1 tons, online customs data showed on Thursday. Shipments to Hong Kong fell 26 percent to 30 tons.
Trading volume for bullion of 99.99 percent purity in China, the benchmark spot contract, jumped about 60 percent from the previous month to a record in March, Shanghai Gold Exchange data show. Flows to India rose before this month’s Akshaya Tritiya festival, which is considered a traditional day to buy precious metals.
Switzerland imported 97.2 tons from the U.K. last month, up from 14.7 tons in February and the most since November. Total Swiss gold exports increased 65 percent to 223.3 tons, the highest since at least 2013.”
The walk-in cash trade was somewhat active with most action mixed between buying and selling. The phones were active in the morning and quiet in the afternoon.
The GoldDealer.com Unscientific Activity Scale is a “ 4” for Friday. The CNI Activity Scale takes into consideration volume and the hedge book: (Monday – 3) (Tuesday – 5) (Wednesday – 5) (Thursday – 4). The scale (1 through 10) is a reliable way to understand our volume numbers. The Activity Scale is weighted and is not necessarily real time – meaning we could be busy and see a low number – or be slow and see a high number. This is true because of the way our computer runs what we call the “book”.
Our “activity” is better understood from a wider point of view. If the numbers are generally increasing – it would indicate things are busier – decreasing numbers over a longer period would indicate volume is moving lower.
When buying or selling you will receive an email confirmation. This includes a PDF File to confirm your invoice or purchase order and includes forms of payment and bank wire instructions. When doing business please check to see if your current email has been entered into the new system and check to see if your computer will accept our email (no spam).
We always appreciate you keeping us up to date when moving or changing your email.
We believe our four flat screens downstairs with live independent pricing (BullionDesk.com) are unique in the United States. The walk-in cash trade can see in an instant the current prices of all bullion products and a daily graph illustrates the range of the markets on any given day.
Yes – you can visit the store with cash and walk away with your product. Or you can bring product to the store and walk away with cash. We will even wire funds into your account that same day for a small service fee ($25.00) if you are in a hurry.
In addition to our freshly ground coffee we offer complimentary cold bottled water, Cokes and Snapple. We also provide fresh fruit in a transparent attempt to disguise our regular junk food habits as we sneak down the block for the best donuts in the world (Randy’s).
Like us on Facebook and follow us on Twitter @CNI_golddealer. Sal is now in charge of our Facebook page and he is a self-proclaimed expert on gold conspiracy theory. He would be happy to respond to even the most ridiculous conspiracy assertion on our Facebook page so why not join the fun?
Thanks for reading – we appreciate your business and enjoy your weekend!
Disclaimer – The content in this newsletter and on the GoldDealer.com website is provided for informational purposes only and our employees are not registered financial advisers. The precious metals and rare coin market is random and highly volatile so it may not be suitable for some individuals. We suggest before deciding on a course of action that you talk with an independent financial professional. While due care has been exercised in development and dissemination of our web site, the Almost Famous Gold Newsletter, or other promotional material, there is no guarantee of correctness so this corporation and its employees shall be held harmless in all cases. GoldDealer.com (California Numismatic Investments, Inc.) and its employees do not render legal, tax, or investment advice.